Creating an example of workflows using DDBJ-KEGG-PDBj
Members:
- Yasumasa Shigemoto (WABI/SABI; DDBJ, Japan)
- Akira Kinjo (PDBj, Japan)
- Soichi Ogishima (Tokyo Medical and Dental Univ, Japan)
- Masumi Itoh (Hokkaido Univ)
with some help from the KEGG people.
Outcome
DDBJ-KEGG-PDBj/Results DDBJ-KEGG-PDBj/Draft
What we want to do
Finding pathway components (enzymes) that are expected to form physical contacts as judged from homologous protein structures.
In short, find the physical protein-protein interaction networks of homologous pathways in various species.
The procedure
Part I
Using KEGG API: http://www.genome.jp/kegg/soap/
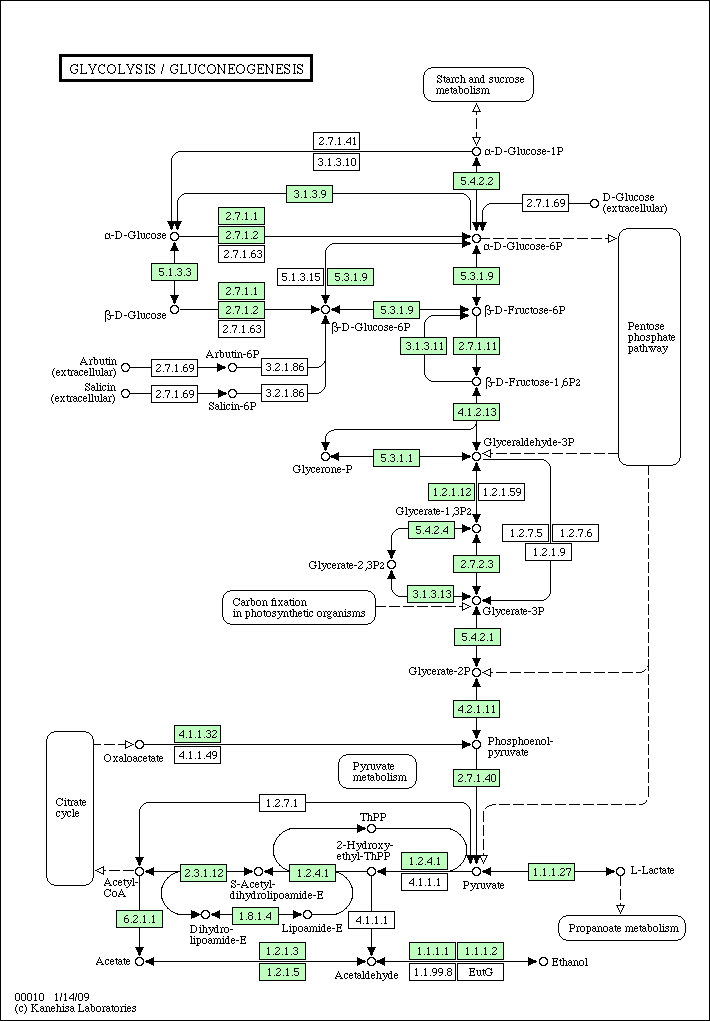
- Pick a pathway of a specific organism, say Glycolysis / Gluconeogenesis pathway of Homo sapiens (human).
- Get all the amino acid sequences of that pathway component (c1, c2, ..., cm).
Part II
Using WABI (DDBJ): http://xml.nig.ac.jp/index.html
- Run blast for each sequence against UniProt(SwissProt / TrEMBL).
- Group the blast results according to biological species (s1, s2, ..., sn).
- For each pathway component (ci), pick the top hit from each species.
- At this step, you have (at most) an m compoents X n species array of protein sequences: Homologous Compoenents Matrix (HCM) or more commonly called Phylogenetic profile.
Part III
Using Sequence Navigator API (PDBj): http://pdbjs3.protein.osaka-u.ac.jp/seqnavix/soap/index.html
- Pick one column (species) of the HCM (sj) For each component of that column, run blast against PDB sequences.
- You will have a list of PDBID and Chain ID as a result of this blast search.
- If the blast results of two components share the same PDB ID but do not share the same Chain ID, they are judged to be in contact.
- By regarding each pathway component as a node, the inferred physical contacts between two components correspond to an edge in the network.
- Iterate the above two steps for each column of the HCM.
- Finally, show the list of inferred PPI of the pathway for each species.
Outline
Here's a pathway of human
Pick amino acid sequences for the pathway components
>comp1
.....
>comp2
....
>comp3
....
After running blast for each pathway component
You will have a list of proteins annotated with species.
Comp1
  protein1 species1 evalue...
  protein2 species2 evalue...
  protein3 species1 evalue...
  protein4 species2 evalue...
  protein5 species3 evalue...
...
Comp2
  protein1 species1 evalue...
...
For each species, select the top hit for each pathway component
That is, filling the phylogenetic profile. In doing so, just select the top hit for each component for each species.
          species1   species2   species3 ... ....... speciesN
-------+---------------------------
comp1  | protein11   protein12   ...
comp2  | protein21   protein22   protein23 ...
comp3  | ...
comp4  | ...
....
compM
Pick one column and run blast against PDB
Let's pick the species j.
for i = 1 to M
    result(i) <- run blast protein(i,j) against PDB

aset := () // empty set.
for i1 = 1 to M-1
  for i2 = i1 + 1 to M
     if result(i1).pdbid = result(i2).pdbid
         and result(i1).chainID <> result(i2).chainID then
        push (i1,i2,result(i1).pdbid)  aset
- Maybe we should not limit to the condition "pdbid1=pdbid2 and chainID1 <> chainID2".
- Sometimes, two or more genes may be merged in one sequence. In that case, they will match the same chain ID but with non-overlapping regions.
Day 3 (Mar. 19)
- Part I is done. Part II is almost done. working on the routine for filling phylogenetic profile.
- Ogishima-san says he can draw the colored pictures of the final output.
- Some difficulty with Perl. Switch to Java?
- PDBj's SeqNavi? SOAP API is out-dated (Axis 1.1). Use perl.
Output format
- After Part II is finished, we have a phylogenetic profile.
KEGG_pathway_id
\tab species1\tab species2\tab species3 ... ....... speciesN
comp1\tab protein11\tab protein12   ...
comp2\tab protein21\tab protein22   protein23 ...
comp3\tab ...
comp4\tab ...
....
compM
where comp1, comp2, ... are KEGG gene ID's, species1, species2, ... are species names, and protein11, protein12, etc. are UniProt ID's.
- After Part II is finished, we have a interaction network.
>species1
c1\tab c2\tab PDBID\tab chainID1\tab chainID2
c2\tab c4\tab PDBID\tab chainID2\tab chainID4
//
>species2
c1\tab c3\tab PDBID\tab chainID1\tab chainID3
...
//
>speciesN
..
//
Example output of UniProt -> PDB
sp|P0AFG9       tr|B2NWK6       1WE5,B,A
sp|P0AFG9       tr|B2PN41       1WE5,B,A
tr|A1A7G1       tr|A7ZHK4       1C4T,A,C
tr|A1A7G1       tr|Q1RG76       1C4T,A,C
tr|A7ZHK4       tr|Q1RG76       1C4T,A,C
tr|B2NWK6       tr|B2PN41       1WE5,B,A
Day 4 (Mar 20): Codes
Coloring a pathway according to phylogenetic profiles
- Import of phylogenetic profile of a KEGG pathway
- Setting nodes and the corresponding colors
- Species pathway: if a node (gene/protein) is identified in each species, the corresponding node is colored in red in each species pathway (if not, colored in green).
- Conservation pathway: a node (gene/protein) is colored according to an evolutionary conservation.
- Obtaining URLs of GIF image files (species pathways and a conservation pathway as defined above) by calling KEGG API (KeggColorPathwayByObjects?)
- Downloading these GIF image files, and obtaining species pathways and a conservation pathway
Adding edges to a pathway according to protein-protein interactions
- Get a .coord file by FTP from the GenomeNet? site
- Load coordinates for protein boxes on a map from the .coord file
- Load protein-protein interaction (PPI) edges from an input file
- Compute start and end points of edges from coordinates of boxes
- Draw PPI edge lines on the input pathway map
Attachments
-
hsa00010.gif
 (18.8 KB) - added by akinjo
16 years ago.
Glycolysis pathway of human
-
pdb_result.tgz
 (0.8 KB) - added by yshigemo
16 years ago.
-
sp_kegggene_matrix.xls
 (336 bytes) - added by yshigemo
16 years ago.
-
species1.gif
 (95.0 KB) - added by ogishima
16 years ago.
-
species2.gif
 (95.0 KB) - added by ogishima
16 years ago.
-
species3.gif
 (95.0 KB) - added by ogishima
16 years ago.
-
sp1-3_conservation.gif
 (108.4 KB) - added by ogishima
16 years ago.
-
Escherichia_coli_O1_K1_APEC.gif
 (55.8 KB) - added by ogishima
16 years ago.
-
Escherichia_coli_O139_H28_strain_E24377A_ETEC.gif
 (55.8 KB) - added by ogishima
16 years ago.
-
Escherichia_coli_O157_H7.gif
 (55.8 KB) - added by ogishima
16 years ago.
-
Escherichia_coli_O157_H7_str_EC4076.gif
 (55.8 KB) - added by ogishima
16 years ago.
-
Escherichia_coli_O157_H7_str_EC4196.gif
 (55.8 KB) - added by ogishima
16 years ago.
-
Escherichia_coli_strain_UTI89_UPEC.gif
 (55.8 KB) - added by ogishima
16 years ago.
-
Citrate_cycle_conservation.gif
 (55.7 KB) - added by ogishima
16 years ago.
-
sample.gif
 (26.4 KB) - added by itoh
16 years ago.
sample map with artificial data
-
sp_kegggene_matrix.2.xls
 (59.1 KB) - added by yshigemo
16 years ago.
-
ppi_by_species.txt
 (80.4 KB) - added by yshigemo
16 years ago.
-
sp_kegggene_matrix.2.tgz
 (9.4 MB) - added by ogishima
16 years ago.
-
sp_kegggene_matrix.3.xls
 (57.4 KB) - added by yshigemo
16 years ago.
-
Yersinia_pestis.gif
 (25.1 KB) - added by itoh
16 years ago.
-
Serratia_proteamaculans_strain_568.gif
 (32.5 KB) - added by itoh
16 years ago.

